Coffee Shop Bloat Test

We all have heard the perennial complaint, “the network is sooo slow.” A primary reason is the inelegantly-named bufferbloat – caused by a bad router that queues up too much data (“the router gets bloated because it buffers too many packets”).

The good news is that a fix has been known for quite a while now, and it’s often a matter of properly configuring the router.

Dave Täht likes to go into coffee shops and help the owners provide better network service for the customers. (Sometimes, he gets a free meal!) He developed a small script for measuring the bufferbloat to use for before and after tests.

I’ve tweaked the script to make it easier to run and display the results. (You still need to install Flent and fping to make it work on your laptop.) But now you can go to your favorite coffee shop to measure the state of the network. See the script at https://github.com/richb-hanover/coffee-shop-bloat-test

US Robotics Acoustic Coupler

Ahhh… the memories… Back in the day (around 1978), I had one of these beauties. All you had to do was place the telephone handset into those cups (really! [1]), dial up your favorite server, and Presto! You were on-line at 300 bits per second. And for only $139 – it was heaven!

While rummaging through my files, I came upon its (dot-matrix) printed manual, so I scanned it for posterity. Enjoy!

Photo credit: http://www.swtpc.com/mholley/USR/USR_Modem.htm

[1]: Wait… What? You had to insert the handset into those cups? Why? AT&T insisted on this  to “prevent damage to the telephone system” from third-party (unlicensed, untested, unreliable) equipment. Only after the Carterphone decision in 1968 would AT&T allow you to make any sort of electrical connection to the phone network. Before that, you could not connect your own telephone (you had to rent one from AT&T), or a fax machine, or a modem, etc.

USR-310 Acoustic Coupler Manual

RandomNeuronsFiring.com – now live!

I have reworked my blog so that the primary domain name is “Random Neurons Firing” (instead of the pedestrian richb-hanover.com). Same content, but a better name.

I’m also adding a new topic to those I’ve previously covered (“Software, Networking, Life”). Over the last two years, I have gone to many planning and zoning conferences to learn more about how to provide attractive housing within communities. I’ll post my notes from those conferences and workshops here. I need to note that these will be my own opinions, and not those of any public boards to which I might belong.


Feel free to share this post on Facebook, LinkedIn, Twitter, or email by clicking one of the icons below. Any opinions expressed here are solely my own, and not those of any public bodies, such as the Lyme Planning Board or the Lyme Community Development Committee, where I am/have been a member. I would be very interested to hear your thoughts – you can reach me at richb.lyme@gmail.com.

Netflow Collectors for Home Networks

Update – November 2017: Added descriptions for the other tools I had investigated.
Update – October 2018: Although it’s not based on Netflow, Al Caughy’s YAMon provides a good view of the traffic flowing through an OpenWrt or DD-WRT router. I use it myself.

Now that LEDE Project has an official release, I hungered for a way to see what kinds of traffic is going through my network. I wanted to answer the question, “who’s hogging the bandwidth?” To do that, I needed a Netflow Collector.

A Netflow Collector is a program that collects flow records from routers to show the kinds and volumes of traffic that passed through the router. The collector adds those flow records into its internal database, and lets you search/display the data. (You also need to configure your router to send (“export”) flow records to the collector. My experiments all employ the softflowd Netflow Exporter. It is a standard package you can install into your LEDE router.)

In an earlier life, I used a slick commercial Netflow monitoring program. But it wasn’t free, so it isn’t something that I can recommend to people for their home networks.

There are many open-source Netflow collectors which have varying degrees of ease of installation/ease of use/features. Most have install scripts that show the steps required to install it on an Ubuntu or CentOS machine, but they are fussy, and require that you have a freestanding computer (or VM) to run it.

Consequently, I created Docker containers that have all the essential packages/modules pre-configured. This means that you can simply install the Docker container, then launch it on a computer that’s continually operating, and let it monitor the data.

This is the first of a series of postings about Netflow Collectors. They include:

  • Webview Netflow Reporter Netflow collector and web-based display program. Makes it easy to see fine-grained information about traffic. More…
  • NFSEN/NFDUMP Netflow collector and web-based display program. Provides attractive graphs, and automatically detects Netflow exporters (so you can skip one configuration step.) More…
  • FlowViewer Another Netflow Collector with web-based GUI. I created a Docker Container for FlowViewer
  • FlowBAT A Javascript Netflow collector and display program. This requires an old version of Meteor (0.9.1), and seems not to be currently maintained. The Github repo for FlowBAT has been updated to install using the required (old) version of Meteor.
  • DDWarden This claims to work with DD-WRT’s rflow protocol (very similar to Netflow v5). No further investigation because I was interested in something to work with LEDE/OpenWrt.
  • Generating Netflow Datagrams A few ways to generate Netflow data: softflowd to run on LEDE/OpenWrt routers and nflow-generator to send mock data in the absence of real traffic.

Net Neutrality – Contacting the Congress (update)

The Battle for the Net site https://www.battleforthenet.com/ no longer seems to have the telephone form(!)

But… Boing Boing does. Go to https://boingboing.net/. You’ll see a popup window with a place to enter your phone number. Click OK, and they pop up a script on-screen.

They call you, you answer, then you supply your zip code.

Then they place calls to each of your legislators (in the House and Senate), then if you have time, they call the offices of Mitch McConnell, Chuck Schumer, and other leaders, so you can deliver the message.

I say my name, home town, and then ask that the FCC preserve the current Title II Net Neutrality rules. The staffer who answers is gonna be busy – you might chat them up though to see if they’re getting slammed. (Mitch McConnell’s office wasn’t even answering(!))

Monopoly ISPs are a Fallacy?

Although I usually agree with him, one of my favorite bloggers, Dave Winer, recently said this:

One of the ideas circulating is that your ISP has a monopoly, owns the only way for you to get to the Internet, but that’s an old idea, it’s no longer true. Where I live the wireless vendors are just as fast as the wired ISP. The cost is still prohibitive, I still need wifi, but given an economic incentive to replace Comcast and Spectrum et al, some wireless vendor is going to step in, probably the smaller ones who aren’t yet owned by one of the big ISPs. Google could buy Sprint for example, and provide a route-around.

I wish I had the same competitive landscape that Dave enjoys. I wish this were true for the rest of the country. But the FCC’s own report from June 2016 (see page 8) shows that 58% of the country’s census blocks have 0 or 1 provider of 25/3 Mbps internet service. This seems a lot like a monopoly.

Let me tell you about the facts on the ground in my town of 1700 people in rural New Hampshire. My conversations with others in the region indicate these conditions hold in huge numbers of communities throughout much of New Hampshire, Vermont, and Maine.

  • The best internet service in town is from Fairpoint. It’s possible to get DSL service to any home, but it’s still just DSL (and often very slow): they’re the only game in town.
  • There is a wireless ISP, but the hilly terrain means their service is OK (10/1 Mbps) if you can get it, but only selected areas can be served.
  • What about cable? Comcast finagled their claim to serve the entire zip code by providing service to one cluster of homes on the southern town border. They refuse to provide cable/internet service to the town center, let alone any place a mile away from there.
  • And cell service? There’s only one bar in the center of town. You can’t make a phone call, so you sure couldn’t use the cell service for data.

So our incumbent ISP (Fairpoint) has a de facto monopoly position, with no alternatives in sight.

I wish that we could rely on the entrepreneurial impetus to sweep away bad, monopolistic ISPs. But we can’t – at least not in any reasonable time frame. The incumbents have rigged the system. NH law (instituted at the behest of the incumbent providers) prevents towns and cities from bonding to create their own municipal networks.

Back to the initial point: The FCC is making rules that seem to assume that we can “just switch carriers” if we don’t like their offering. Yet they fail to provide evidence that any such competitive service exists.

I say, leave the Net Neutrality rules alone until there’s a far better competitive landscape that would allow me to shop around for an ISP that provides options I might care for.

End of the Internet? Help us prevent it!

Hat tip to Ro Khanna‏ (@RoKhanna on Twitter) for this…

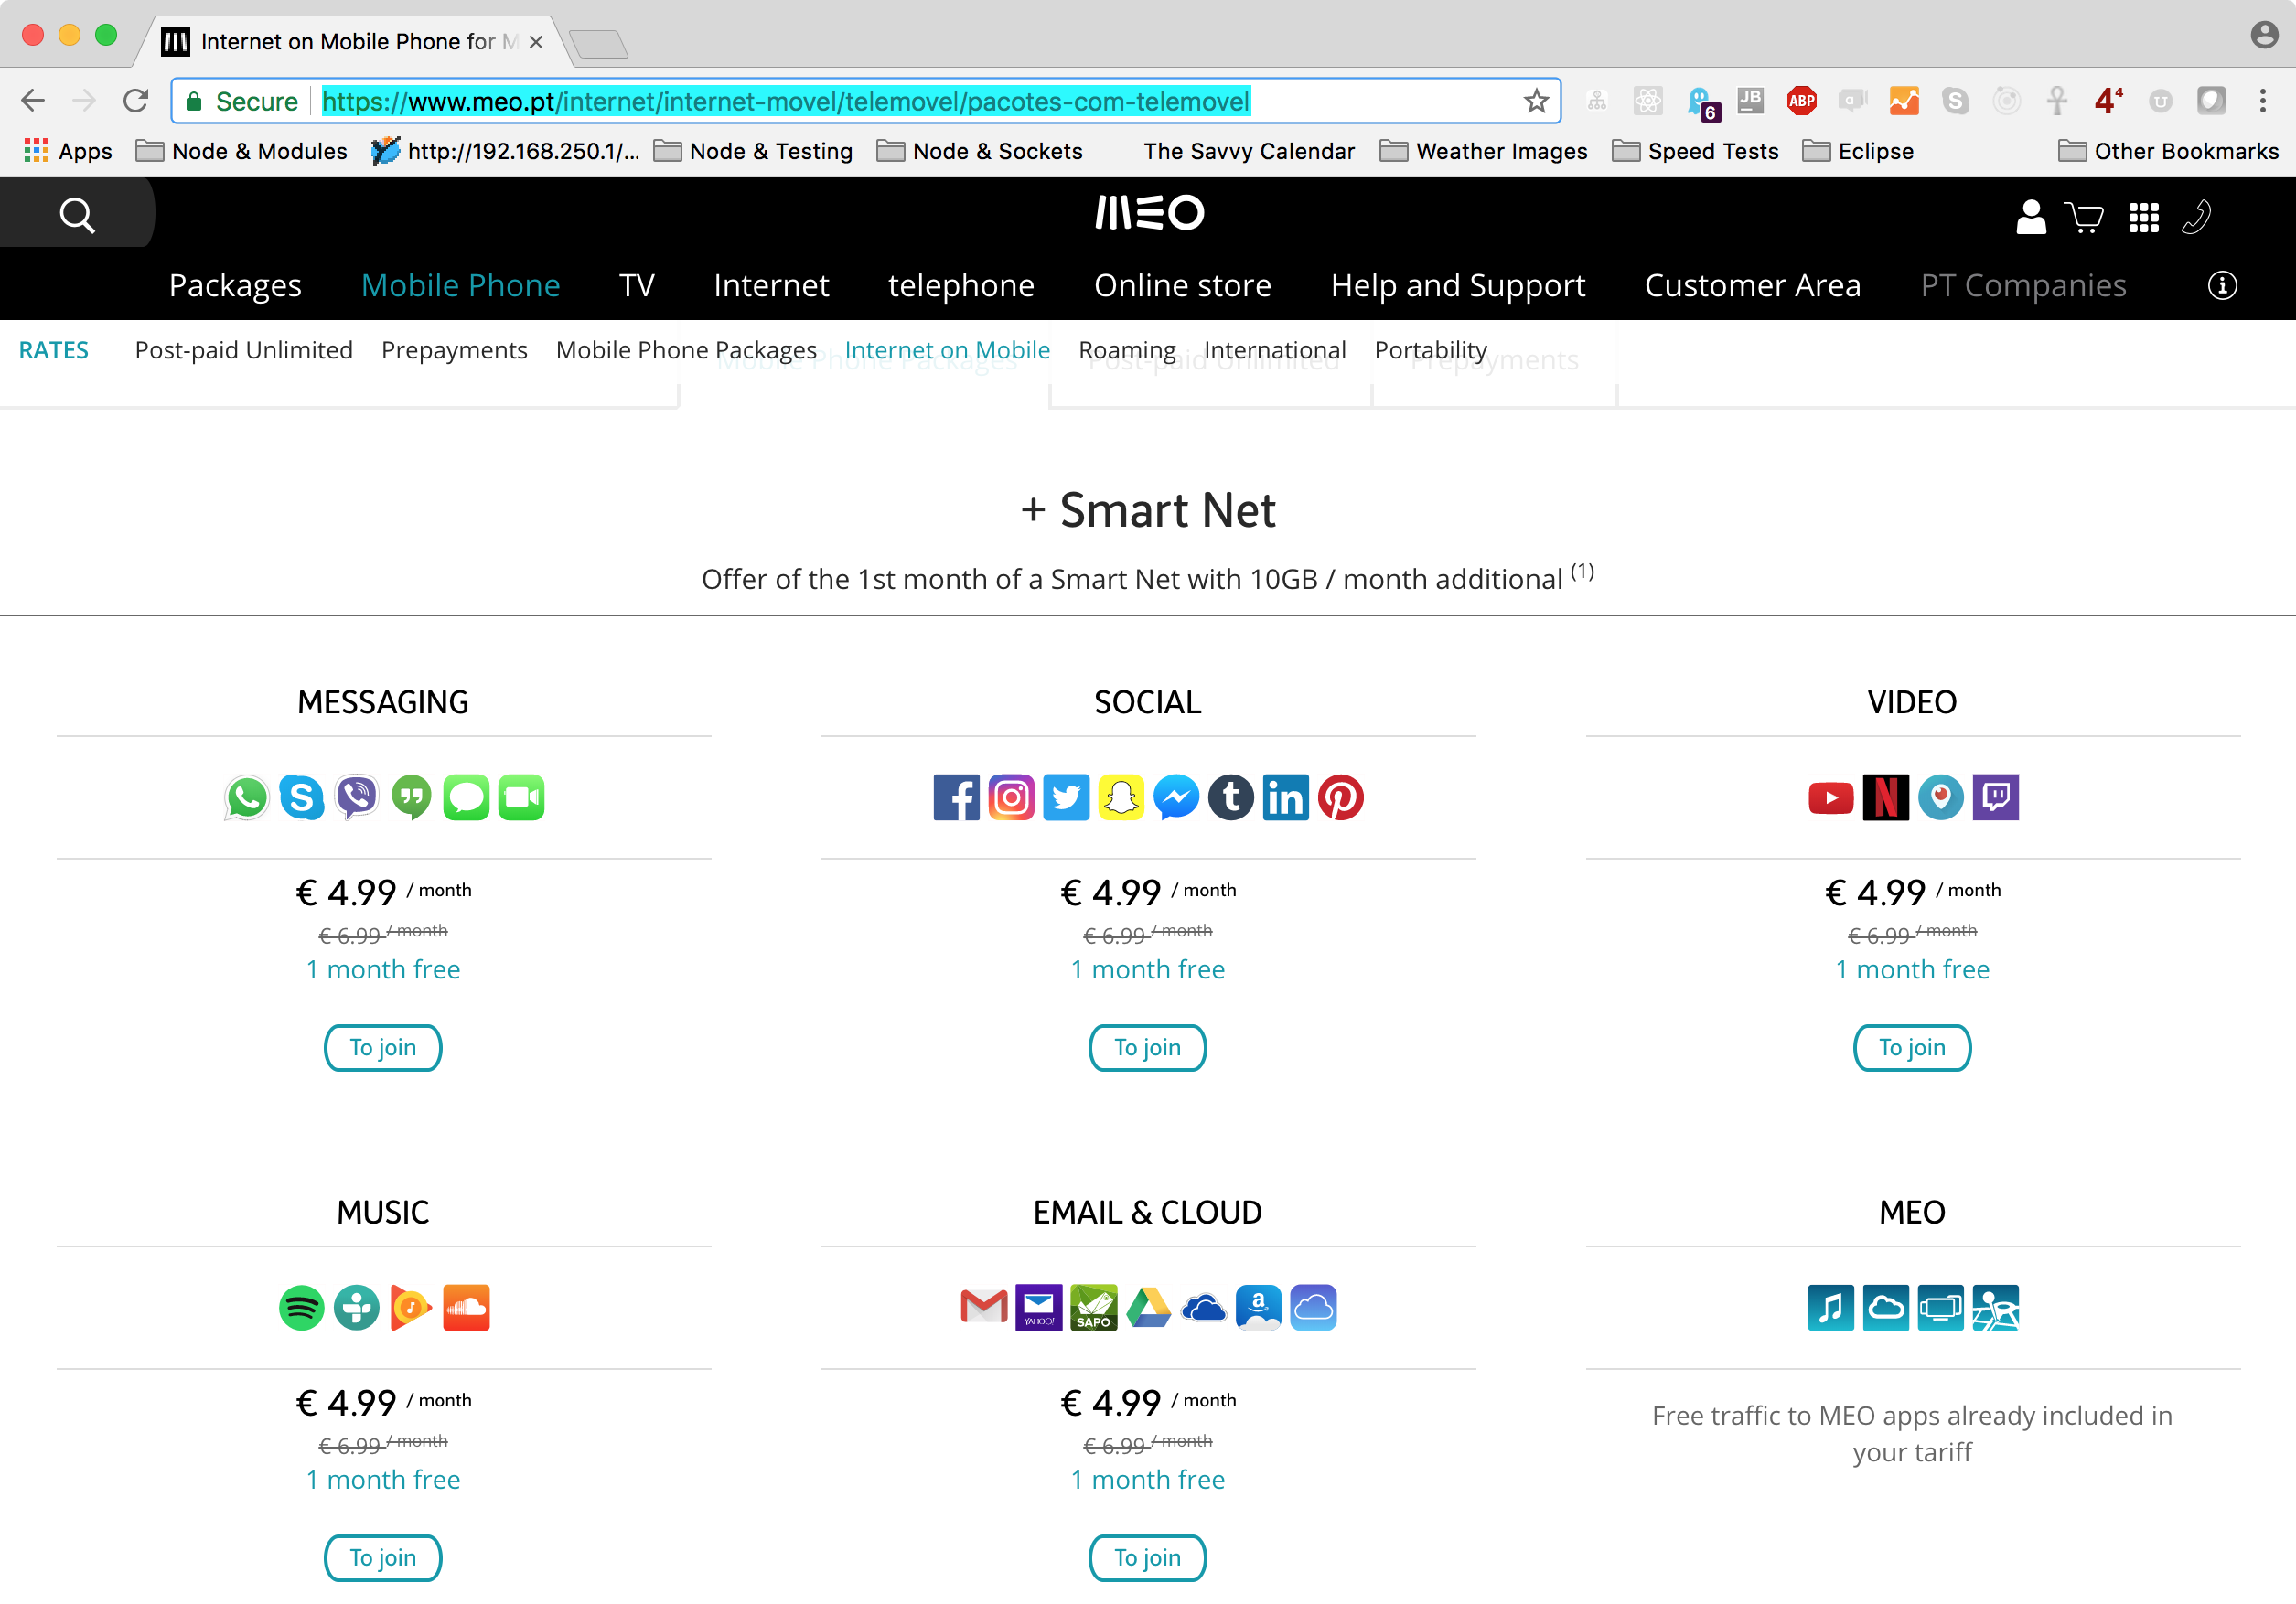
A Portugal ISP (with no net neutrality constraints) appears to be charging 4.99€ (about US$5.86) per month for access to social media. And another 4.99€ for streaming video (Youtube, Netflix, etc). Oh, and another 4.99€ for streaming music. And additional charges for other kinds of network traffic. Here’s a link to their web page. which I ran through Google Translate to make it easier to read.

Telemoval page from Portuguese ISP

The FCC has proposed to end the rules that prevent ISPs from slicing and dicing up your access to the entire internet.

The FCC rules (released this week) are scheduled to be voted into effect on 14 Dec 2017.

This will be really bad for consumers. But it’ll be worse for entrepreneurs who’re not big companies (yet), and could easily be left “below any horizon”, and simply not visible to general customers.

What can I do?

John Oliver’s TV shows generated over 22 million comments on the FCC site, but they chose to disregard the public’s sentiment.

However, the Congress can tell the FCC not to issue these rules. But they need to know that people really care. The easiest way to make your voice heard is to call Congress directly. It sounds like a hassle, but it really isn’t…

The folks at Battle for the Net make it super easy. Give them your phone number, then they dial up your congressperson’s office, then ring your phone. They even give you a script to tell the staffer (who’ll probably answer the phone) and you tell them what you’re thinking. A 30-second call would be enough to let them know your thoughts.

Generating Netflow Records

[Part of the series of blog postings on Netflow]

Netflow is a network protocol invented by Cisco that provides granular visibility on network utilization. Routers and switches send (“export”) Netflow datagrams that summarize traffic through them to a Netflow Collector program that displays the data. This gives visibility into “who’s using the network?”

Virtually all Netflow collectors are able to process Netflow version 5 packets, so they provide a minimal level of useful functionality.

About Other “Flow Protocols”: Netflow v9, IPFIX, and sFlow

Netflow version 9 can handle IPv6 addresses (v5 cannot). Many exporters (routers and software) can also export version 9 datagrams. There are other interesting enhancements of Netflow v9, but they generally are not operationally important for basic installations.

IPFIX is sometimes called “Netflow v10” because it is a superset of v9. It, too, is not generally important for basic installations.

sFlow (“sampled flow”) is an alternate flow generation technique that works well in settings with very high packet rates. Because the router only needs to report on a sample of the traffic (say one in 10 or 100 packets), sFlow decreases load on the router as well as the generated traffic. Many Netflow collectors can also handle sFlow, but it may not be important for a basic installation.

Configuring Cisco, Juniper, and other commercial equipment

There are a zillion vendor and other websites that tell how to configure your commercial routers. Look there.

Configuring LEDE and OpenWrt to export Netflow data

Equipment from Linksys, D-Link, TP-Link, and dozens of other “home router” vendors can export netflow datagrams if they run the LEDE or OpenWrt software and the softflowd package.

To do this, install LEDE/OpenWrt on your router, then install the softflowd package. (Ask on the forums if you have questions about this.)

Edit /etc/config/softflowd to have these settings. (Change 192.168.1.1 below to the IP address of your Netflow Collector program.)

root@LEDE:~# cat /etc/config/softflowd
config softflowd
    option enabled        '1'
    option interface      'br-lan'
    option pcap_file      ''
    option timeout        'maxlife=60'
    option max_flows      '8192'
    option host_port      '192.168.1.1:2055'
    option pid_file       '/var/run/softflowd.pid'
    option control_socket '/var/run/softflowd.ctl'
    option export_version '5'
    option hoplimit       ''
    option tracking_level 'full'
    option track_ipv6     '0'
    option sampling_rate  '0'

Then issue these two commands to start softflowd. Check Troubleshooting (below) to see whether softflowd is working.

service softflowd restart
service softflowd enable

Generating ‘mock’ netflow data

If you don’t have a Netflow-capable router handy, you can still test Netflow collector programs by running a program that creates bogus/fake/mock Netflow data.

One such program is nflow-generator. The Github repo describes how to run it: the instructions have been tested on OSX, but should work for Windows or Linux, if the Go language is installed.

nflow-generator also has a Docker container that has the same functions, but this has not had much testing.

Troubleshooting Netflow Exporters with tcpdump

Use tcpdump to determine if your Netflow exporter (router or program) is sending netflow datagrams to the computer where you wish to run the Netflow Collector program.

tcpdump captures and displays traffic with certain characteristics. To capture netflow datagrams, use:

tcpdump -i eth0 port 2055

Notes:

  • You may need sudo (e.g. sudo tcpdump -i eth0...), if you are not running as root.
  • Replace eth0 with the interface name that will be receiving the Netflow traffic.
  • Port 2055 is the default Netflow port; change it to match the port you are using.

If Netflow datagrams are arriving at the host, you will see single-line outputs for each datagram. Use Control-C to stop tcpdump.

If datagrams are not arriving, then check to see that you have specified the correct interface and port in the command above. Also ensure that there is no firewall (either in the network in general, or on the computer running tcpdump) that might be blocking the traffic.

This article is a part of the Netflow Collector series.

nfsen-dockerized Netflow Collector

[Part of the series of blog postings on Netflow]

A lightweight Netflow collector and web display based on NFSEN/NFDUMP in a Docker container. NFSEN and NFDUMP are documented and hosted at SourceForge.net

This container listens on ports 2055, 4739, 6343, and 9666 for netflow, ipfix, and sFlow exports. It displays the collected data in a web interface.

Check the Github repo. The files from the /docs directory have more info. Major thanks go to https://github.com/nerdalert/nfsen-dockerized
for a start on this Dockerfile and all the supporting documentation.

Pros:

  • Pretty graphs, for varying time periods: daily, weekly, monthly, yearly.
  • View data from a specific time period by going to Details, then dragging the thumbs at the bottom of the graph.
  • Top-N talkers also available from Details page: scroll to the bottom of the page, configure “Options”, the click “process”
  • Automatically detects the netflow exporter(s).
  • Lightweight – Runs on a modest computer. Works great if you’re only handling a single home-router’s flow exports. I haven’t tested it with more exporters/more traffic.
  • The Docker container displays graphs “out of the box”.

Cons:

  • Home page shows 12 charts, one each for flows/sec, packets/sec, and bits/sec, for each of the four time periods. This makes it hard to know what to “focus on” when you’re just starting up, since none of the charts has very much data.
  • Also, showing charts with “Flows/sec” makes it seem as if that’s a critical statistic. But Bit/sec is more important (IMHO).
  • Selecting a time period to view is a little clunky. (It’d be fun simply to drag across the graph…)
  • Alerts and Stats seem a bit inscrutable.
  • I briefly tried to install the “FlowDoh” plugin that purports to display Top-N talkers. It was probably my error, but it just didn’t work after a “good try” to use it.
  • As-is, this Docker instance only handles a single exporter (my home router), since the Docker networking doesn’t distinguish external exporter addresses.

This article is a part of the Netflow Collector series.

Webview Netflow Reporter (wvnetflow)

[Part of the series of blog postings on Netflow]

Webview Netflow Reporter is a lightweight Netflow collector and web display tool based on wvnetflow and flow-tools in a Docker container. Webview Netflow Reporter was created by Craig Weinhold craig.weinhold@cdw.com. The original wvnetflow site is hosted at SourceForge.net.

The Dockerfile is available from Github.

wvnetflow screen shot

Pros

  • Pretty graphs – Displays stack charts of the kinds of traffic (web, email, network, telnet, ssh, dns, mysql, sip, p2p, file server, etc) flowing through the router at any time. See the graphic above.
  • Click on an interesting point of the graph, and see exactly what traffic was being sent during that period.
  • Automatically detects exporters – no configuration required.
  • Lightweight – Runs on a modest computer. Works great if you’re only handling a single home-router’s flow exports. I haven’t tested it with more exporters/more traffic.
  • The Docker container comes pre-configured to display charts “out of the box”.

Cons

  • No automatic way to see “top talkers” – who’s hogging the bandwidth. You have to click the graph, then scroll through a table of hosts that were transmitting at the time.
  • One-minute granularity – The lowest granularity is one minute, despite the fact that the flow data has millisecond accuracy.
  • Five-minute time chunks – Data only gets updated every five minutes. This probably could be configured to change the processing rate.
  • Text-based configuration – Configuration files are arcane.
  • As-is, this only handles one exporter. See Known Issues/Questions
  • There’s an outstanding issue where there are gaps in the displayed charts. Hopefully this will be resolved.

This article is a part of the Netflow Collector series.